Productive agriculture is acidifying. Amongst other causes such as nutrient leaching, acidity develops by the removal of alkaline organic matter, which in simple terms removes positively charged hydrogen ions, leaving behind an imbalance, and resulting in acids soils. Intensive cropping systems are generally more acidifying than perennial pasture systems, however some legume pastures with high rates of dry matter removal for hay can also be very acidifying.
Soil Test Interpretation Guide
for Dryland Pastures in Tasmania - Naomi Palombi, Doris Blaesing
APPENDICES
Chapters
APPENDICES
Appendix 1: Acidity and management of acid soils:A legume that can't fix nitrogen properly might as well be a grassSalinity and management of saline soilsSodicity and managing sodic soilsAppendix 2: Organic Carbon in Tasmanian Perennial PasturesFactors that determine the potential storage of organic carbon (OC) in soils.Appendix 3: Colwell P levels, PBI, PERIPhosphorus environmental risk index (PERI)
Appendix 1: Acidity and management of acid soils:
A legume that can't fix nitrogen properly might as well be a grass
Different pasture species have different tolerances to acidity. Intolerances to acidity generally arise from an increase in exchangeable aluminium, and hence aluminium toxicity. This primarily affects legume modulation and nitrogen fixing capacity. For soils that are strongly to extremely acid, appropriate acid-tolerant pasture species should be chosen, as well as adopting a liming strategy.
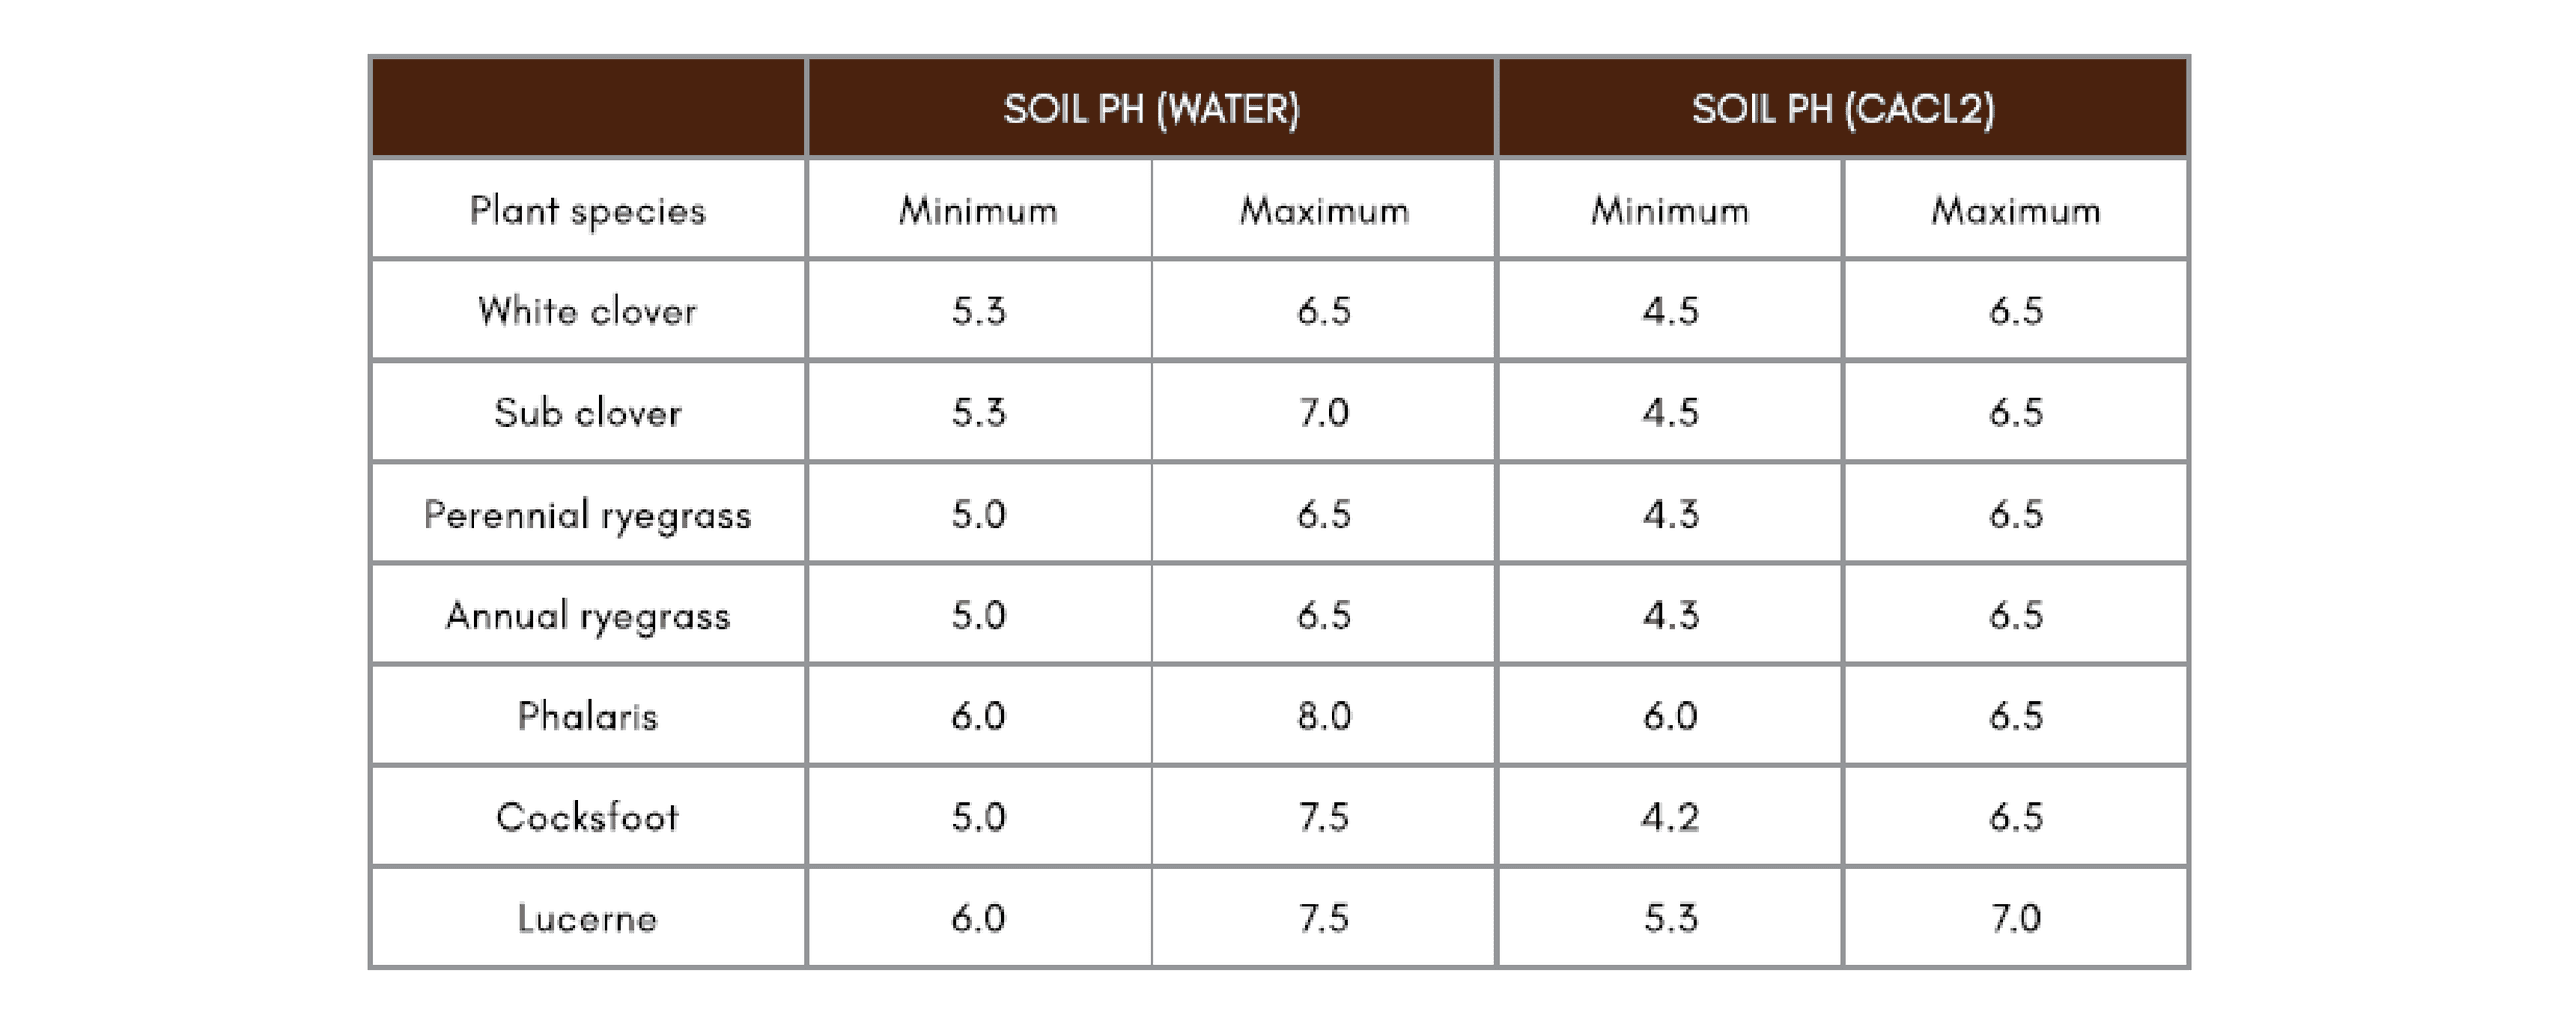
Table A1-1: pH tolerance of common pasture species (31)
Liming is the only known treatment for soil acidity, and the amount of lime needed to increase the pH will depend on the effective neutralising value (ENV) of the product. ENV not only takes into account the neutralising value (NV) of a product, but also particle size, measure of change in pH, and a measure of solubility. These four measures are expressed as a percentage (ENV). The NV and particle size of a lime product greatly affect the amelioration effect on soil pH32. For liming to neutralise acid soils, it needs to be in contact with the acid soil, which creates some difficulty in perennial pasture systems, to achieve better results from liming, less lime should be applied more frequently, even annually, in some cases where soils are strongly acid.
When measuring the change in pH, it is crucial to check not just the top 0-10cm, but also 10-20 cm, and 20-30cm depending on the soil type. In strongly acid soils, soil testing pH in 5cm increments provides more precise information on the level of acidity down the profile. If subsoil acidity is not addressed by liming, rooting depth and pasture resilience will continue to be constrained, as shown in Figure A 1-1.
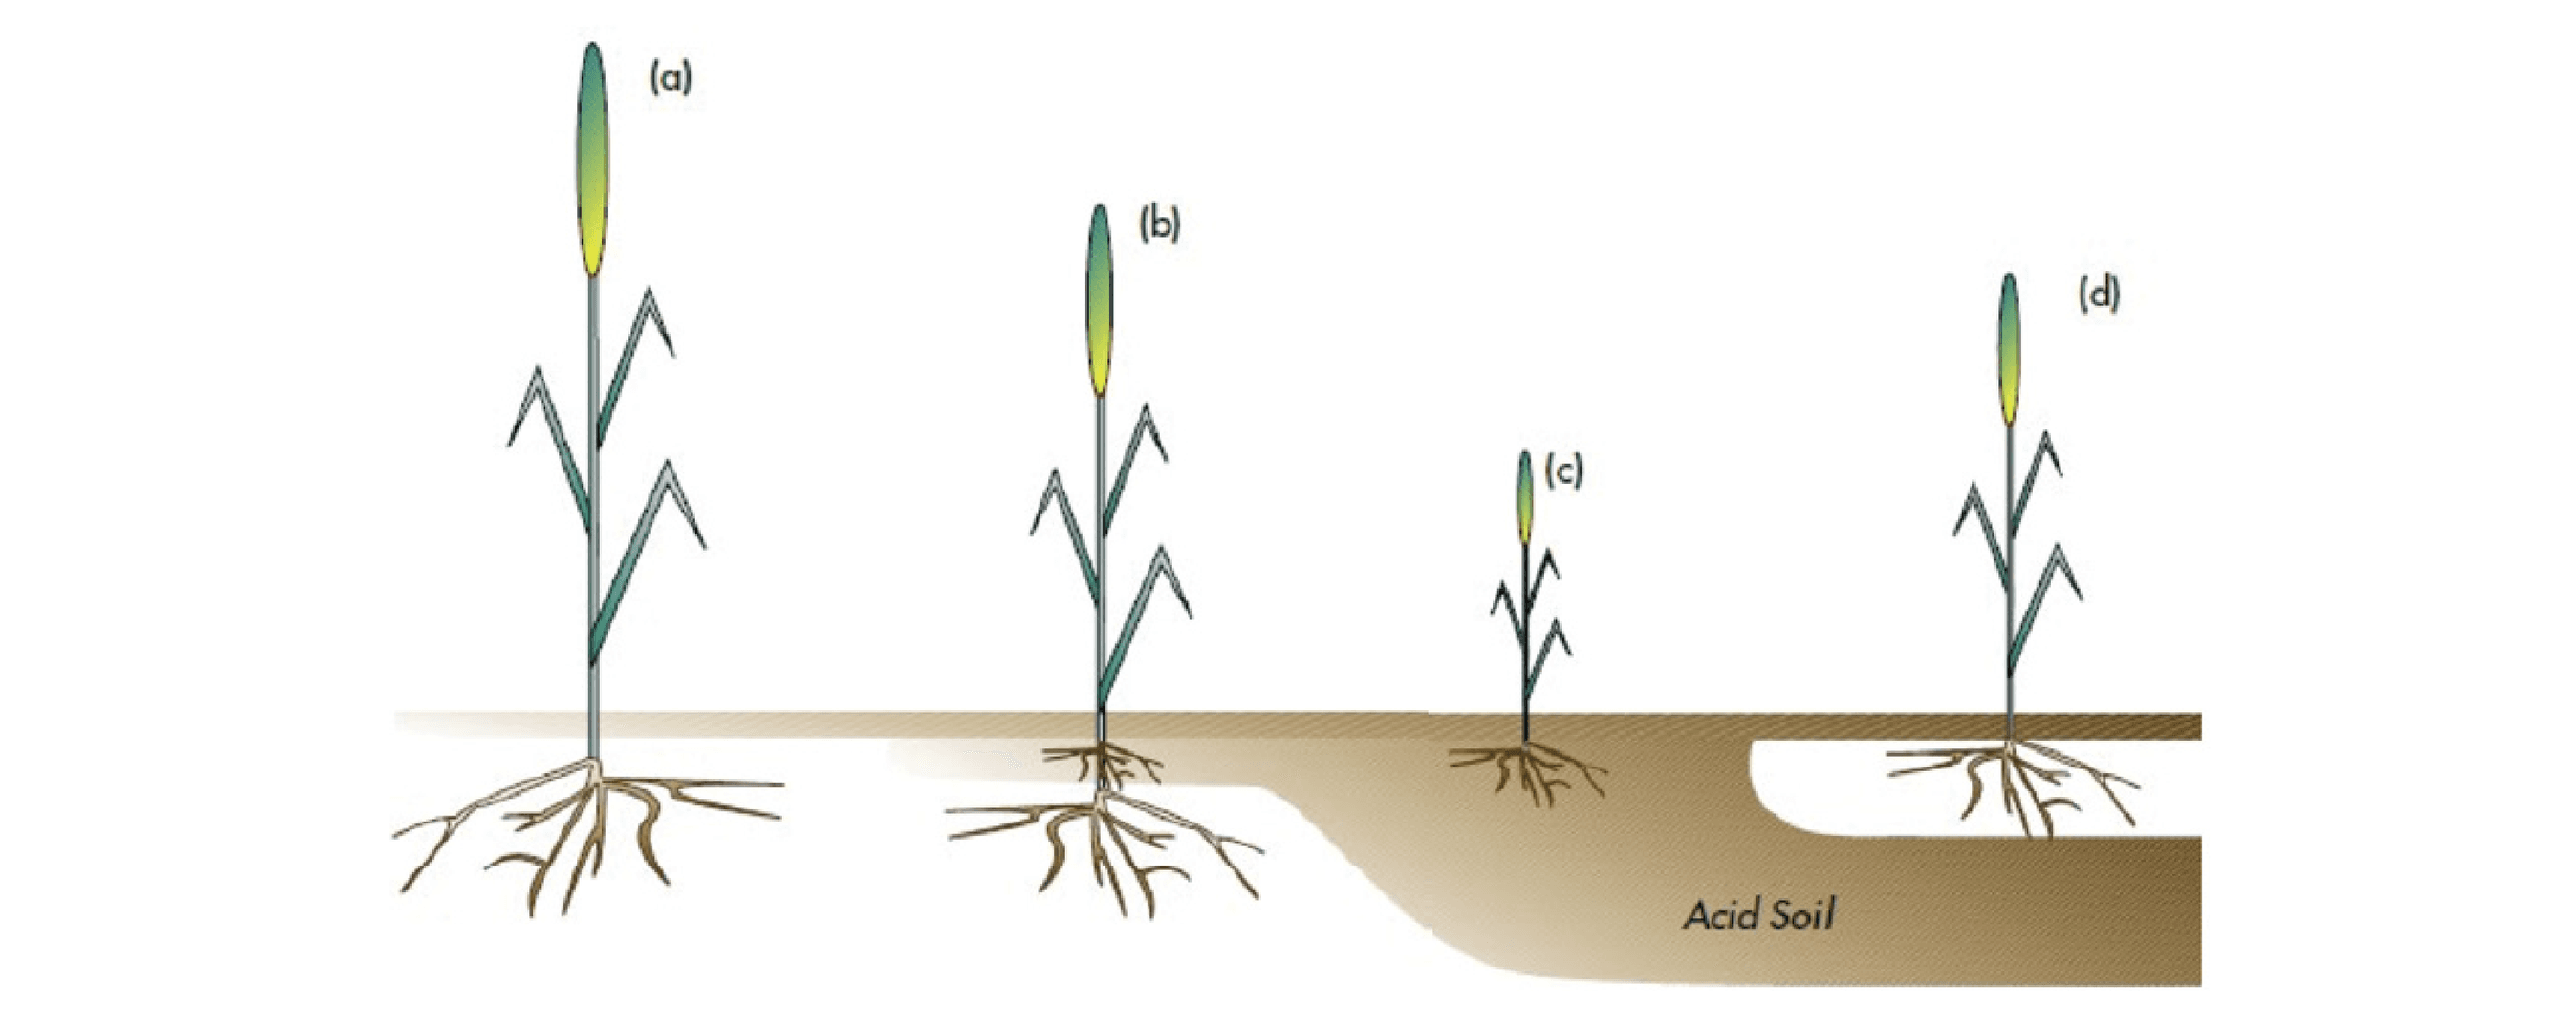
Figure A1-1: Plant vigour in (a) non-acid soil (b) surface acidity (c) acidity (d) sub-soil acidity (33)
Current practice typically involves liming just enough to bring pHCaCl ₂ just above 5, to address Aluminium toxicity. However, in maintaining this practice, subsoil acidity remains unchecked. Research 34 from Dr James Condon (Charles Sturt University) and MLA has shown that liming to maintain pHCaCl₂ above 5.5 is needed to address subsoil acidity over time, and thereby increase soil health, production, resilience, and persistence. A lime target in the topsoil of 5.9 pHCaCl₂ is sufficient over time to alleviate the constraints of subsoil acidity.
Acid soils affect more than just the amount of exchangeable aluminium, they also affect the availability of other nutrients such as Mg and Ca, as there are fewer holding sites in the soil, and then also subsequently more leaching. Aluminium also binds well to phosphate, resulting in less availability for plants. There is a risk that trace elements and micronutrients decrease in availability, resulting in decreased uptake by plants, and hence livestock, resulting in deficiencies and poor health outcomes.
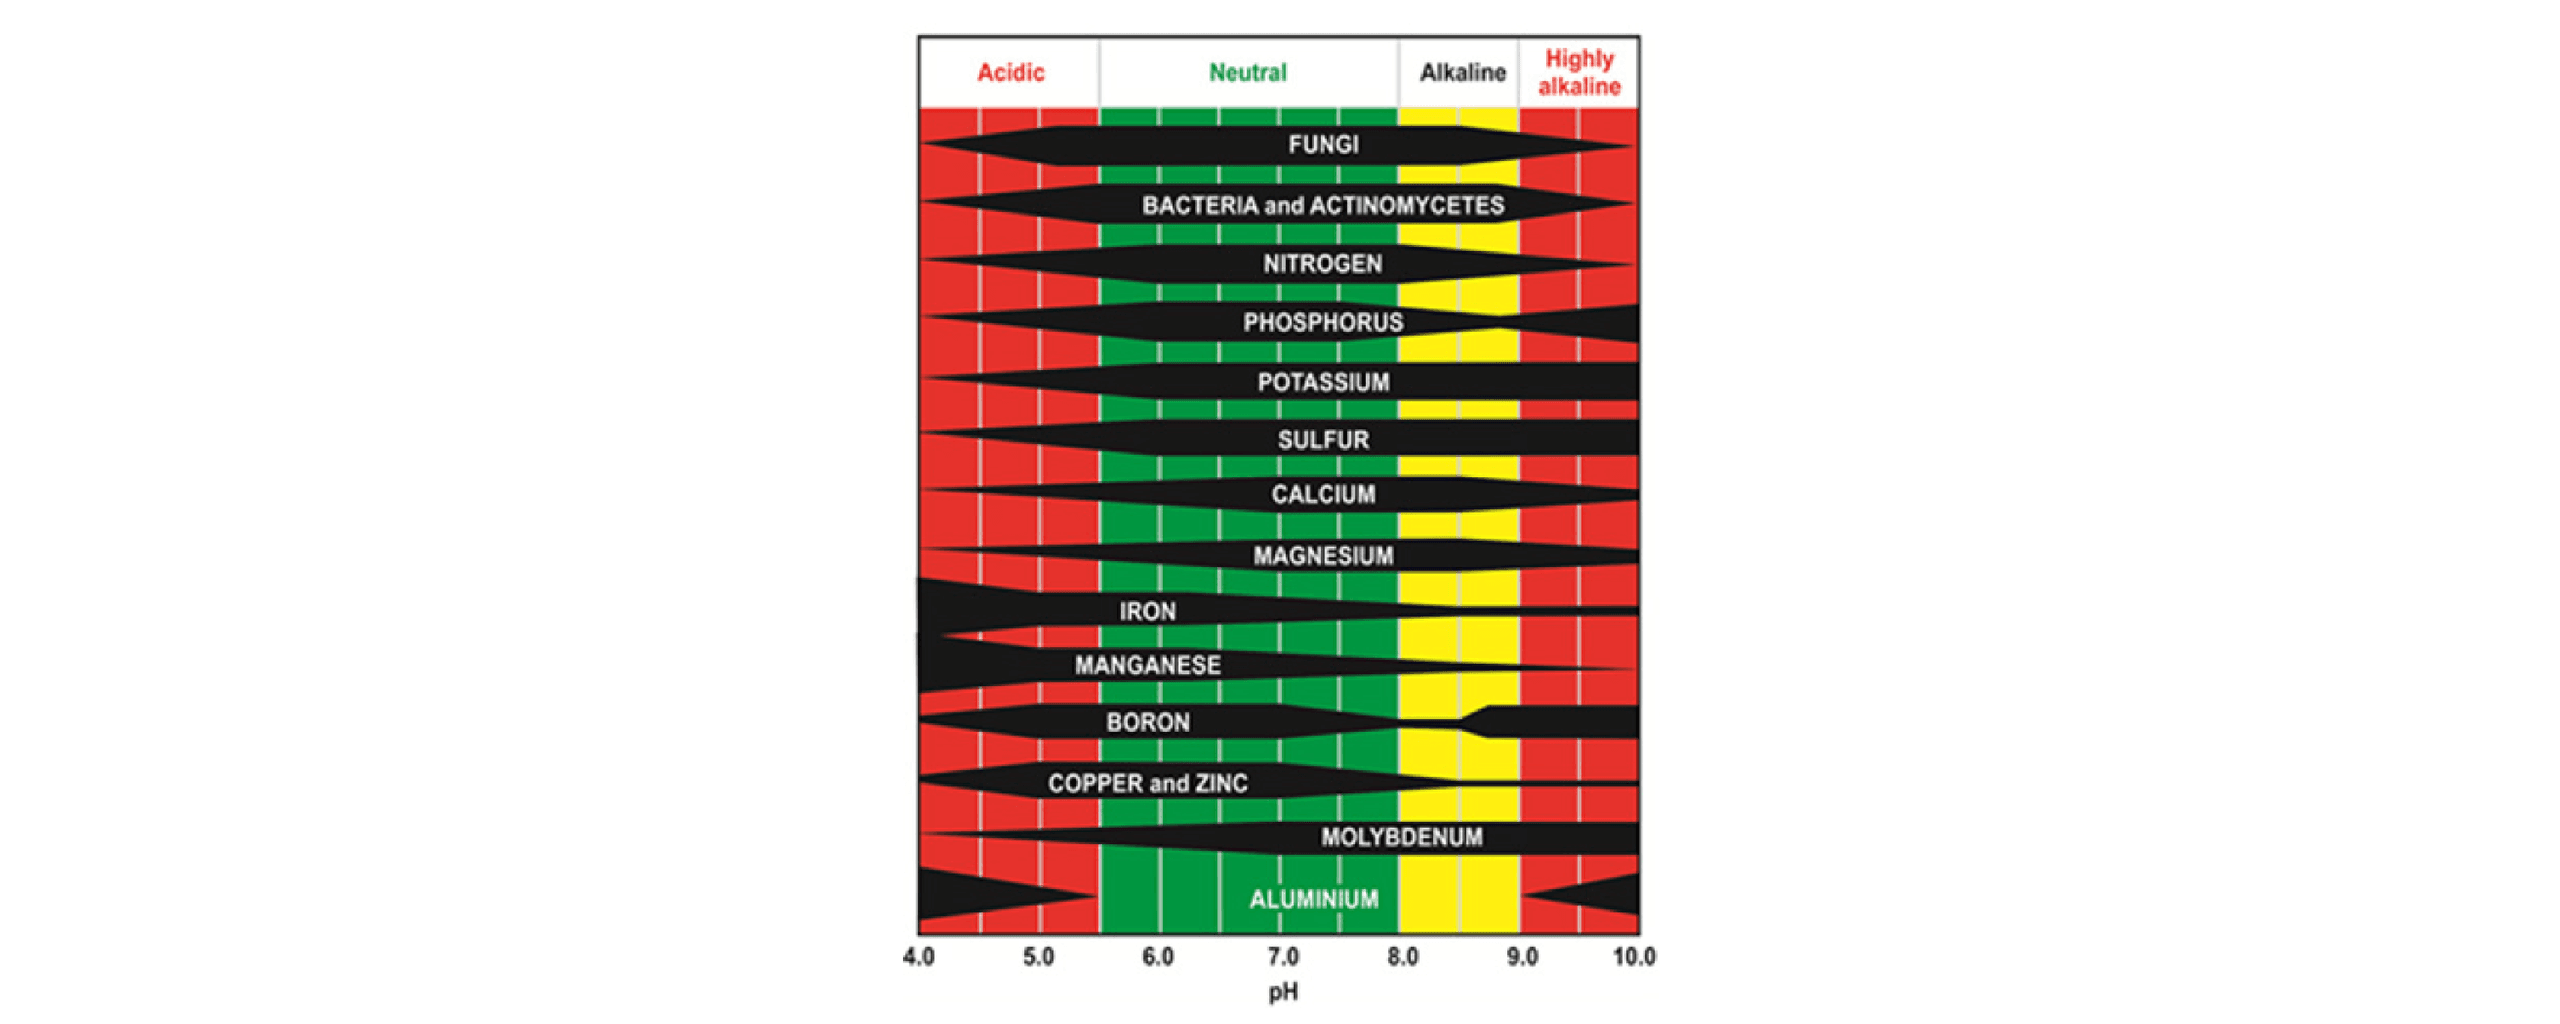
Figure A1-2: Effect of pH on nutrient availability and biology (35). Cotching 2023 provides more information on lime products, neutralising values, and rates in Chapter 4 of Nutrient Management for Farming in Tasmania.
Salinity and management of saline soils
Managing Saline Soils
Salinity occurs when there is an accumulation of salts in the soil, which can be naturally occurring or exacerbated by land use change. Salinity is most often viewed as being blatantly obvious, with bare salt-encrusted ground. However, moderate salinity can be present, with the only symptom being poor pasture growth. Aside from reduced productivity, signs of moderate salinity can be the presence of salt-tolerant weeds such as buck’s horn plantain, sea barley grass, and yellow water buttons. Some bare patches may also be evident in severe cases.
Salinity can be caused by the presence of naturally occurring salt in the soil and underlying rock formations. In some cases, the accumulation of salts in groundwater is due to land-use changes such as clearing, persistent waterlogging, and excessive fertiliser applications with a high salt index. Coastal areas can have surface saline areas arising from wind and rain salt deposits, such as on the east coast of Tasmania.
Salinity can occur due to a combination of natural and human factors, and
it is important to understand the causes and potential impacts of soil salinity in order to effectively manage and mitigate its effects on soil health and productivity.
Managing salinity in dryland pastures requires a multi-faceted approach, however prevention should be the primary goal. Improving riparian zones and drainage management can be an effective way to mitigate salinity. This can involve diverting saline water away from pastures, improving riparian vegetation, and establishing deep-rooted pasture species to reduce waterlogging and increase soil permeability. Deep-rooted species can access water and nutrients that are beyond the reach of other, more shallow grasses. Combined with the use of salt tolerant species (Table A 1-2), this can help improve soil structure and increase water infiltration, which can reduce the likelihood of waterlogging and further salinity. Carefully avoiding over-grazing of areas prone to salinity will also help limit the severity of waterlogging. Land Drainage for Farming in Tasmania by Bill Cotching and Samantha Gadsby (2023) contains further advice on land drainage management.
Table A1-2: Saline-tolerant pasture species and registered cultivars.
SPECIES - Annual Grasses
- Burr medic
- Barrel medic
- Snail medic
- Messina
- Sphere medic
- Balansa clover
- Persian clover
- Bokhara clover/White Sweetclover
REGISTERED CULTIVAR - Annual Grasses
- Serena, Scimitar, Santiago, Cavalier
- Caliph
- Sava, Silver, Essex
- Neptune
- Orion
- Frontier, Paradana
- Prolific, Nitro Plus, Kyambro, many more
- Jota
SPECIES - Temperate Annual Grasses
- Annual ryegrass
- Italian ryegrass
REGISTERED CULTIVAR - Temperature Annual Grasses
- Wimmera, Safeguard
- Many cultivars
SPECIES - Perennial Legumes
- Lucerne
- Strawberry Clover
REGISTERED CULTIVAR - Perennial Legumes
- Many cultivars
- O'Connors, Palestine
SPECIES - Temperate Perennial Grasses
- Tall wheat grass
- Tall fescue
- Phalaris
REGISTERED CULTIVAR -Temperature Perennial Grasses
- Dundas, Tyrell
- Many cultivars
- Many cultivars
Adapted from, Pasture legumes and grasses for saline land in Western Australia, by The Department of Primary Industries and Regional Development of Western Australia (2021) and, Species for Profit, by Department of Primary Industries, Parks, Water and Environment (2021).
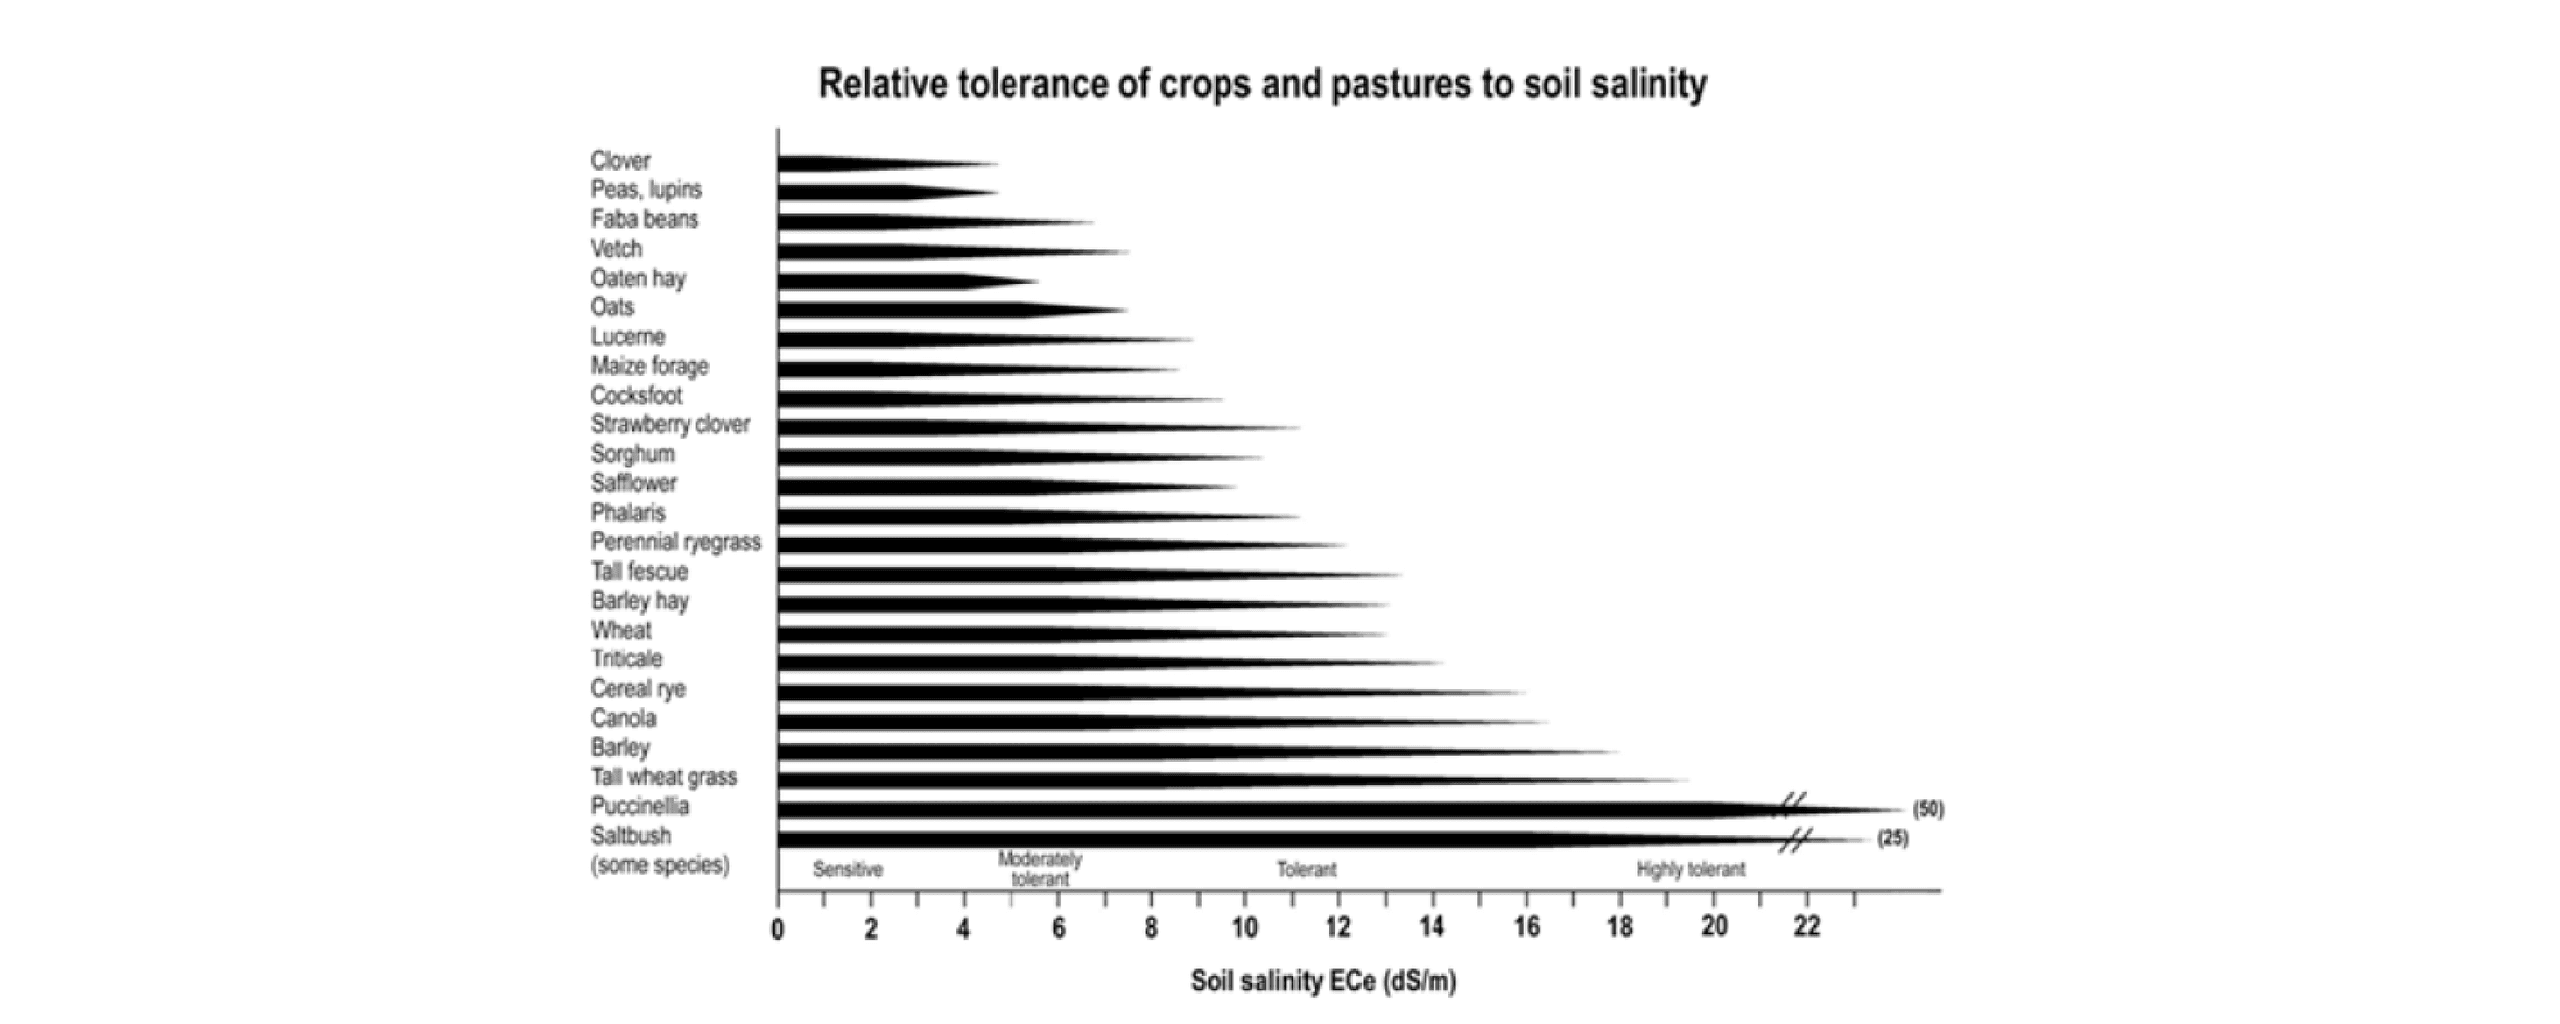
Figure A1-3: Relative tolerance of crops and pastures to soil salinity (36)
Soil test measurements
Most soil test reports show Electrical Conductivity measured in a 1:5 soil:water solution. Data on the salt tolerance of plants is usually based on the electrical conductivity of a saturated extract ECSE (dS/m). Results need to be converted to ECSE figures to check against salinity tolerance figures for crop. The conversion of the laboratory result from an EC 1:5 test to ECSE involves multiplying it by a factor that depends on your soil texture (Table A1-3).
For example, an EC 1:5 of 0.4 dS/m on a clay loam soil (multiplication factor of
9) gives an ECe value of 0.4 dS/m x 9 = 3.6 dS/m.
If soil texture is not determined, laboratories may provide ECe data by multiplying EC 1:5 results by a factor of 10.
| SOIL TEXTURE GROUP | MULTIPLICATION FACTOR | IF EC 1:5 = 0.2 THEN ECe = BELOW [DS/M] |
|---|---|---|
| Sands, loamy sands | 13 | 2.6 |
| Sandy loams, fine sandy loams | 11 | 2.2 |
| Loams, very fine sandy loams, silty loams, sandy clay loams | 10 | 2.0 |
| Clay loams, silty clay loams, very fine sandy clay loams, sandy clays, silty clays, light clays | 9 | 1.8 |
| Light medium clays | 8 | 1.6 |
| Medium clays | 7 | 1.4 |
| Heavy clays | 6 | 1.2 |
Table A1-3: Conversion factor of various soil types for EC 1:5 to ECe
| [DS/M] | [MS/CM] | [S/CM] | [MG/KG] | [MILLI MHO/CM] | [MICRO MHO/CM] |
|---|---|---|---|---|---|
| 1 | 1 | 1000 | 670 | 1 | 1000 |
| 0.001 | 0.001 | 1 | 6.7 | 0.001 | 1 |
| 0.00156 | 0.00156 | 1.56 | 1 | 0.00156 | 1.56 |
Table A1-4: Conversion factors for the most used units of measurements for salinity
Sodicity and managing sodic soils
Sodicity is a condition in which soil contains an excessive amount of sodium relative to other cations such as calcium, magnesium, and potassium. This can lead to soil structure problems and reduced nutrient availability, particularly of potassium. Sodic soils tend to have an increased risk of erosion
and waterlogging.
One approach to managing sodicity is to improve soil structure through practices such as deep ripping and the addition of soil amendments like gypsum. Deep ripping can help to break up compacted soil layers and improve water infiltration, while gypsum can help to displace sodium and improve soil structure by promoting the aggregation of soil particles. Another approach is to use tolerant plant species that can grow in sodic soils. These species are adapted to high levels of sodium and can help to maintain productivity in areas with sodic soils. It is important to note, however, that some tolerant species may have lower nutritional value or be less palatable to livestock, so it is important to carefully consider the trade-offs when selecting plant species.
Avoiding grazing when soils are waterlogged can also help reduce the risk of further structural damage to already-sodic soils. Increasing organic matter retention in the soil, either through improved animal waste recycling, or the application of amendments can also help alleviate sodicity. It’s important to regularly monitor soil properties and plant growth to assess the effectiveness of sodicity management practices. This can involve testing soil properties
such as soil pH, electrical conductivity, and sodium adsorption ratio, as well as monitoring plant growth and productivity.
Managing sodicity in dryland pasture situations requires a multifaceted approach that includes improving soil structure, using tolerant plant species, and regular monitoring and assessment of soil and plant properties. By implementing these strategies the negative impacts of sodicity on soil health and productivity can be effectively alleviated.
Appendix 2: Organic Carbon in Tasmanian Perennial Pastures
Total organic carbon is a measure of the carbon contained within soil organic matter. Perennial pasture systems tend to have higher levels of organic carbon than systems in annual cropping rotations because tillage and fallow periods lead to organic
carbon losses.
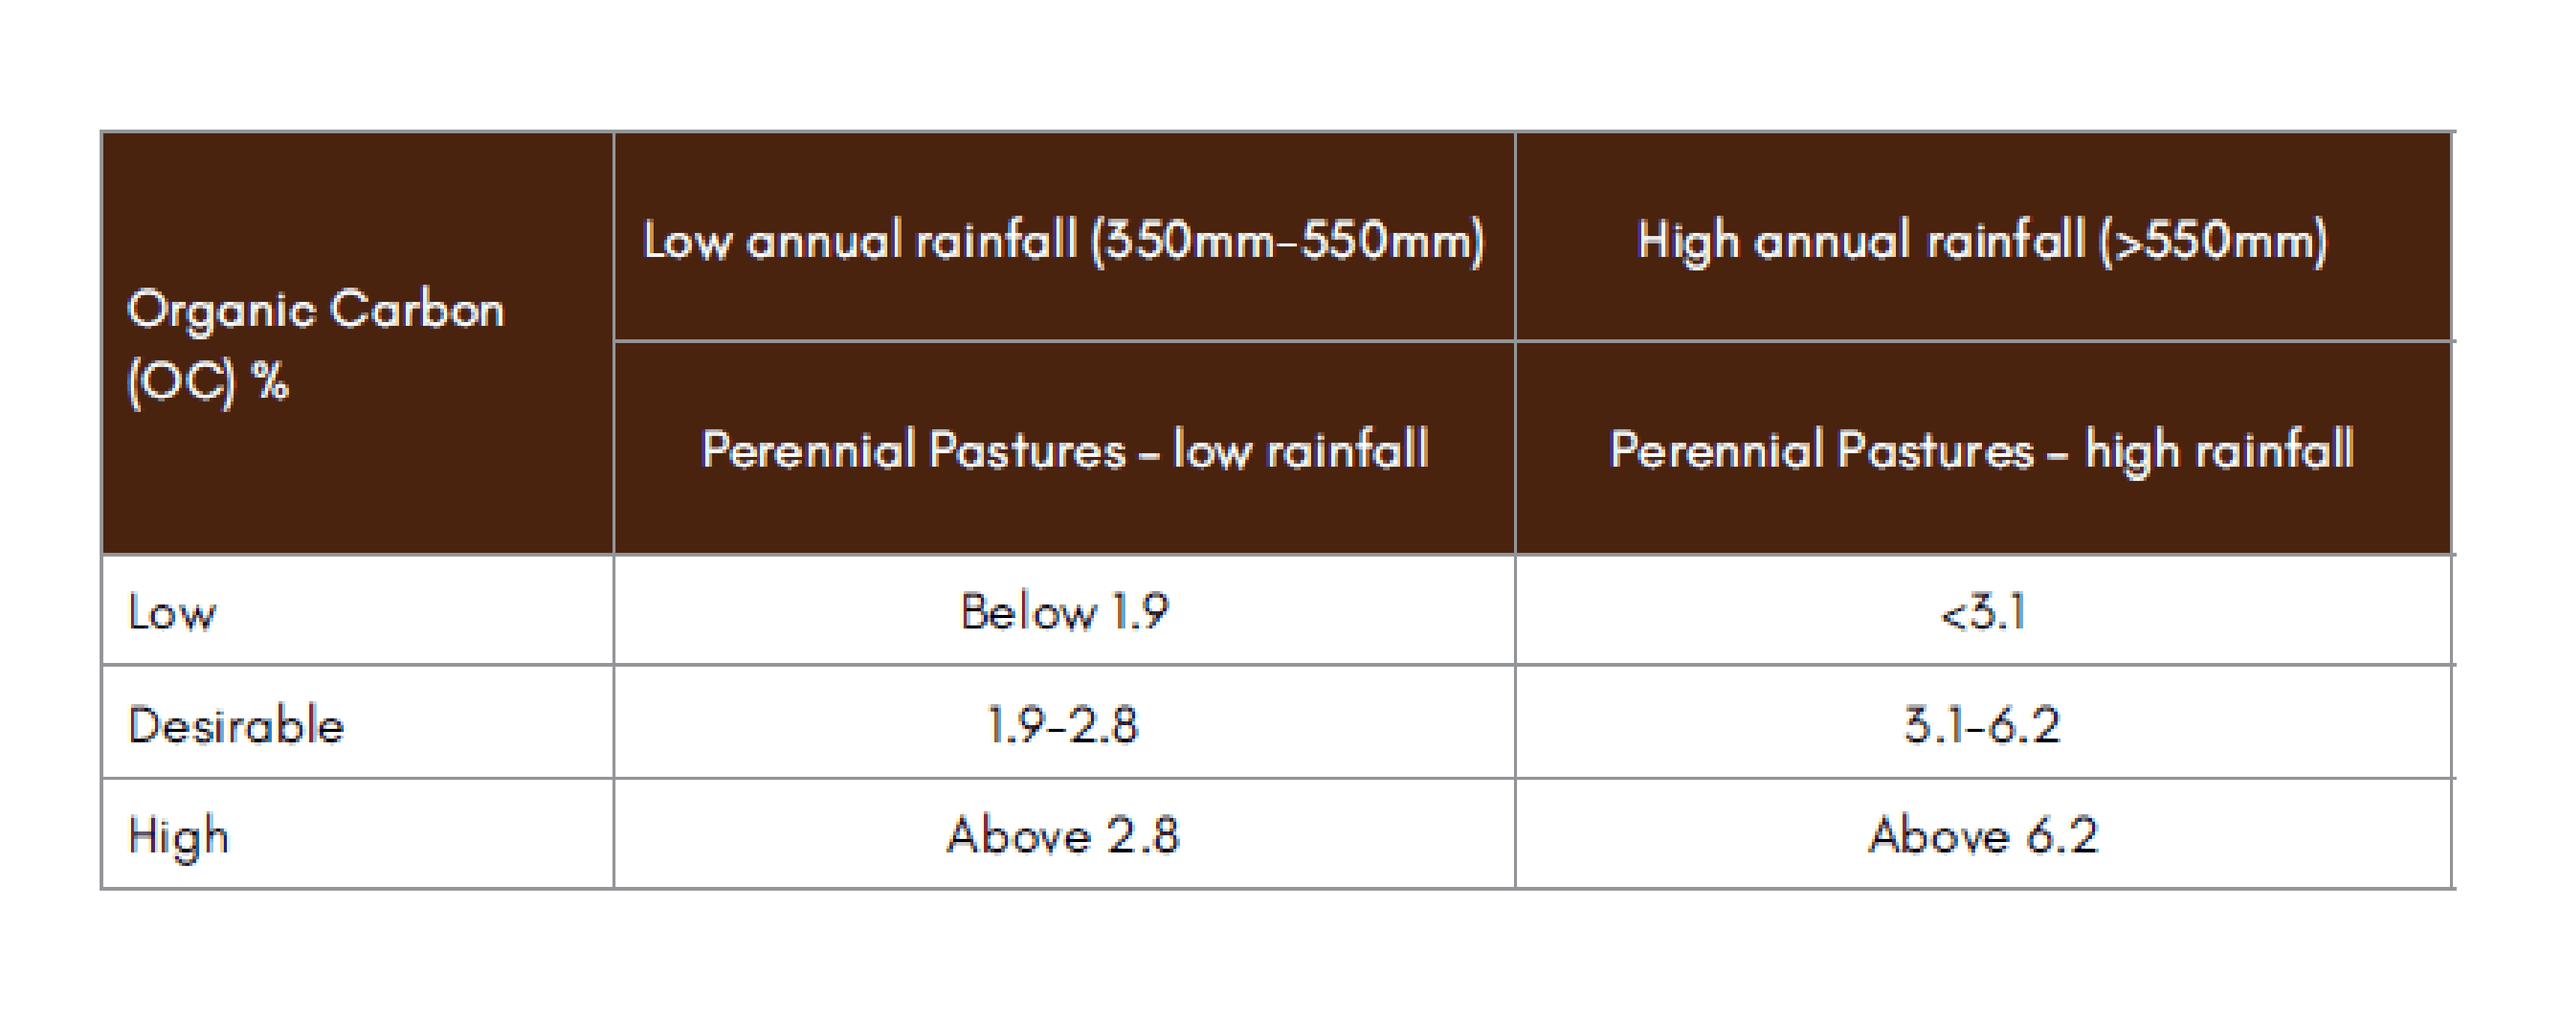
Table A2-1: Overview of organic carbon percentages over a range of conditions (37)
Organic Carbon (OC)38
is the most important driver of nutrient storage, nutrient cycling, soil life and access of roots to nutrients. It improves water storage, soil air supply and feeds soil life.
Labile Carbon
is the fraction of soil organic carbon with most rapid turnover times. Its oxidation drives the flux of CO2 between soils and atmosphere.
Factors that determine the potential storage of organic carbon (OC) in soils.
Soil type (clay content, minerals, density)
The amount of OC stored in soils tends to increase with increasing clay content because the clay reduces access to organic matter (OM) by microorganisms. In sandy soil, microorganisms are able to access OC more easily and oxidise it. This causes greater loss of OC by decomposition in lighter soils.
Climate
Climate determines the possible storage of OC in soil by regulating plant biomass production. Under dryland agriculture for instance, rainfall and temperature are the climate factors that have the most influence on plant productivity and therefore inputs of OC to soil. In regions with high rainfall or in irrigated crops, soils tend to have greater potential storage capacity of OC than the same soil types in a lower rainfall region or without irrigation. OC accumulation drops with temperature because biomass production drops.
Management
Practices that can increase the amount of total OC stored in soil and decrease losses include:
- Increased plant (including root) growth generally increases inputs of OC to soil in shoot material, roots and root exudates, e.g., optimal nutrition, increasing water use efficiency, decreasing disease pressure. If pastures are overgrazed, root and top biomass production declines and OC can drop, depending on how long the situation lasts. Poor soil cover will reduce OC accumulation.
- Growing plants for longer periods each year generally increases inputs of OC to soil, e.g., shorter fallow, conversion from cropping to pasture, conversion from annual to perennial pasture.
- Improving soil structure can increase the amount of OC stored in soil
by reducing losses of OC from soil by decomposition and erosion, e.g., retaining crop residues / stubble, maintaining ground cover and reducing compaction by vehicles and stock.
- Continuous, well managed pastures build organic carbon quicker than other rotations.
Tillage, fallow periods, poor pasture cover and erosion lead to the greatest OC losses. Well managed nutrition and irrigation help to grow more OC; soil amendments e.g., composts or composted manure can be used to import OC.
Microorganisms break down soil organic carbon as an energy source – this occurs faster when the soil is moist and warm. Tillage can enhance microbial breakdown as soil aggregates are disrupted, making protected organic matter available to microorganisms to decompose and because better soil aeration increases microbial activity.
Dung beetles incorporate dung into the soil profile which improves OC levels.
Further information about Organic Matter and Organic Carbon can be found in Chapter 5 of Soil Health for Farming in Tasmania by Bill Cotching.
Appendix 3: Colwell P levels, PBI, PERI
Critical levels for Colwell P measurements vary with soil type. If Colwell P is to be used it must be used in conjunction with PBI (Phosphorous Buffering Index). PBI measures how tightly P binds to soil particles, generally increasing with an increase in clay content.
| PBI RANGE | 0-50 | 50-100 | 100-200 | 200-300 | 300-600 | >600 |
|---|---|---|---|---|---|---|
| Minimum P Limit | 10 | 20 | 30 | 40 | 60 | 60 |
| Maximum P Limit | 20 | 30 | 40 | 60 | 90 | 120 |
Table A3-1: Recommended range for Colwell P levels in perennial pastures, against PBI39
OPTIMUM COLWELL P LEVELS (MG/KG) FOR TASMANIAN SOIL TYPES
| Soil types | Range |
|---|---|
| Ferrosols | 70-120 |
| Chromosols, Kurosols, Podosols, Sodosols, Tenosols | 10-40 |
| Dermosols, Vertosols | 30-70 |
Table A3-2: Recommended ranges of Colwell P for Tasmanian soil types in pasture (40)
Phosphorus environmental risk index (PERI)
Movement of phosphorus (P) from the site of soil application generally occurs because of water movement of organic and mineral sediment to which the P is attached, or dissolved in moving water. The PERI is a calculation that provides some indication of the potential for P to move through the soil with water. It is calculated from the available Colwell P and the Phosphorus Buffer Index (PBI). As the available P to PBI ratio rises, the probability that the P buffer capacity of the soil is exceeded and leaching will occur, increases. Once a critical value of 2 is exceeded the risk of movement of P in the soil decreases.
Phosphorus application, including materials such as manures, composts, bio-solids, and organic by-products containing phosphorus, should be discontinued until the PERI falls to 0.65 or below.
Validation of the PERI is still in progress but sufficiently advanced to provide confidence that it will provide worthwhile comment to defining the line between sufficient P for high productivity and where environmental risk increases.
Adapted from: http://www.backpaddock.com.au/news/explaining-new-calculations-in-soilmate/.
----------------------
31 https://mbfp.mla.com.au/pasture-growth/tool-28-soil-nutrient-critical-limits/
32 https://www.afsa.net.au/images/dowloads/Choosing_a_Lime_20170731102300.pdf
33 Soil acidity and liming: Agfact AC 19 3rd Edition 2005 NSW DPI
34 https://sfs.org.au/resource/sharing-information-webinar-session-2-soil-acidity
35 Incitec Pivot LTD (2008) Agronomy Advantage Manual
37 Adapted from https://mbfp.mla.com.au/pasture-growth/tool-28-soil-nutrient-critical-limits/
38 Adapted from http://www.soilquality.org.au/factsheets/how-much-carbon-can-soil-store and Bill Cotching
39 https://mbfp.mla.com.au/pasture-growth/tool-28-soil-nutrient-critical-limits/